The Two Eras of Climate: Pre-2020 and Post-2020
In the future, we will look back on 2020 as the year that decarbonisation started. This post is a collection of charts that tell this story.
But first, how do we determine the “start of decarbonisation”? We could measure the ambition of national targets, corporate commitments, or public sentiment. But these are indirect metrics. What really matters is how much clean shit we’re building. The end goal of policy, R&D and activism is to replace fossil fuel infrastructure with clean infrastructure.
The 1990s, 2000s, and 2010s laid important foundations (politically & technologically) for the climate movement. But there was little large-scale build out of clean infrastructure. Where the west did "reduce" emissions, it was often through transformations that were going to happen anyway (coal -> gas, efficiency improvements, exporting manufacturing). We developed and tested new climate tech, but we didn't deploy much of it.
In 2020, things started to change. We started deploying climate tech at a rate that surprised the most ambitious analysts. Because of this, between 2020 and 2022, the US, EU and China all announced net zero pledges. Meaningful or not, they were announced because for the first time, a zero-emissions economy seemed possible. (In 2010, when wholesale solar & battery prices were >5x what they are today, a net zero pledge would have been a sure-fire way to get voted out.)
Today, we’re still really off track. But since 2020, we've entered a new era where the rate of change is explosive. Let's call 2020 year zero in the climate calendar. BC = Before Climate. AD = Active Decarbonisation 😎.
Here are a few graphs showing that 2020 was the year decarbonisation started.
Charts
Decarbonisation starts with cheap renewables, because they are upstream of most other climate solutions. Even though electricity generation is only ~27% of our emissions, it will provide the energy to decarbonise most of the rest of them, through electrification. There is no path to zero emissions without wartime-style deployment of renewables.

Whilst most of these additions are in China, the US and the EU, the rest of the world is accelerating fast as well.

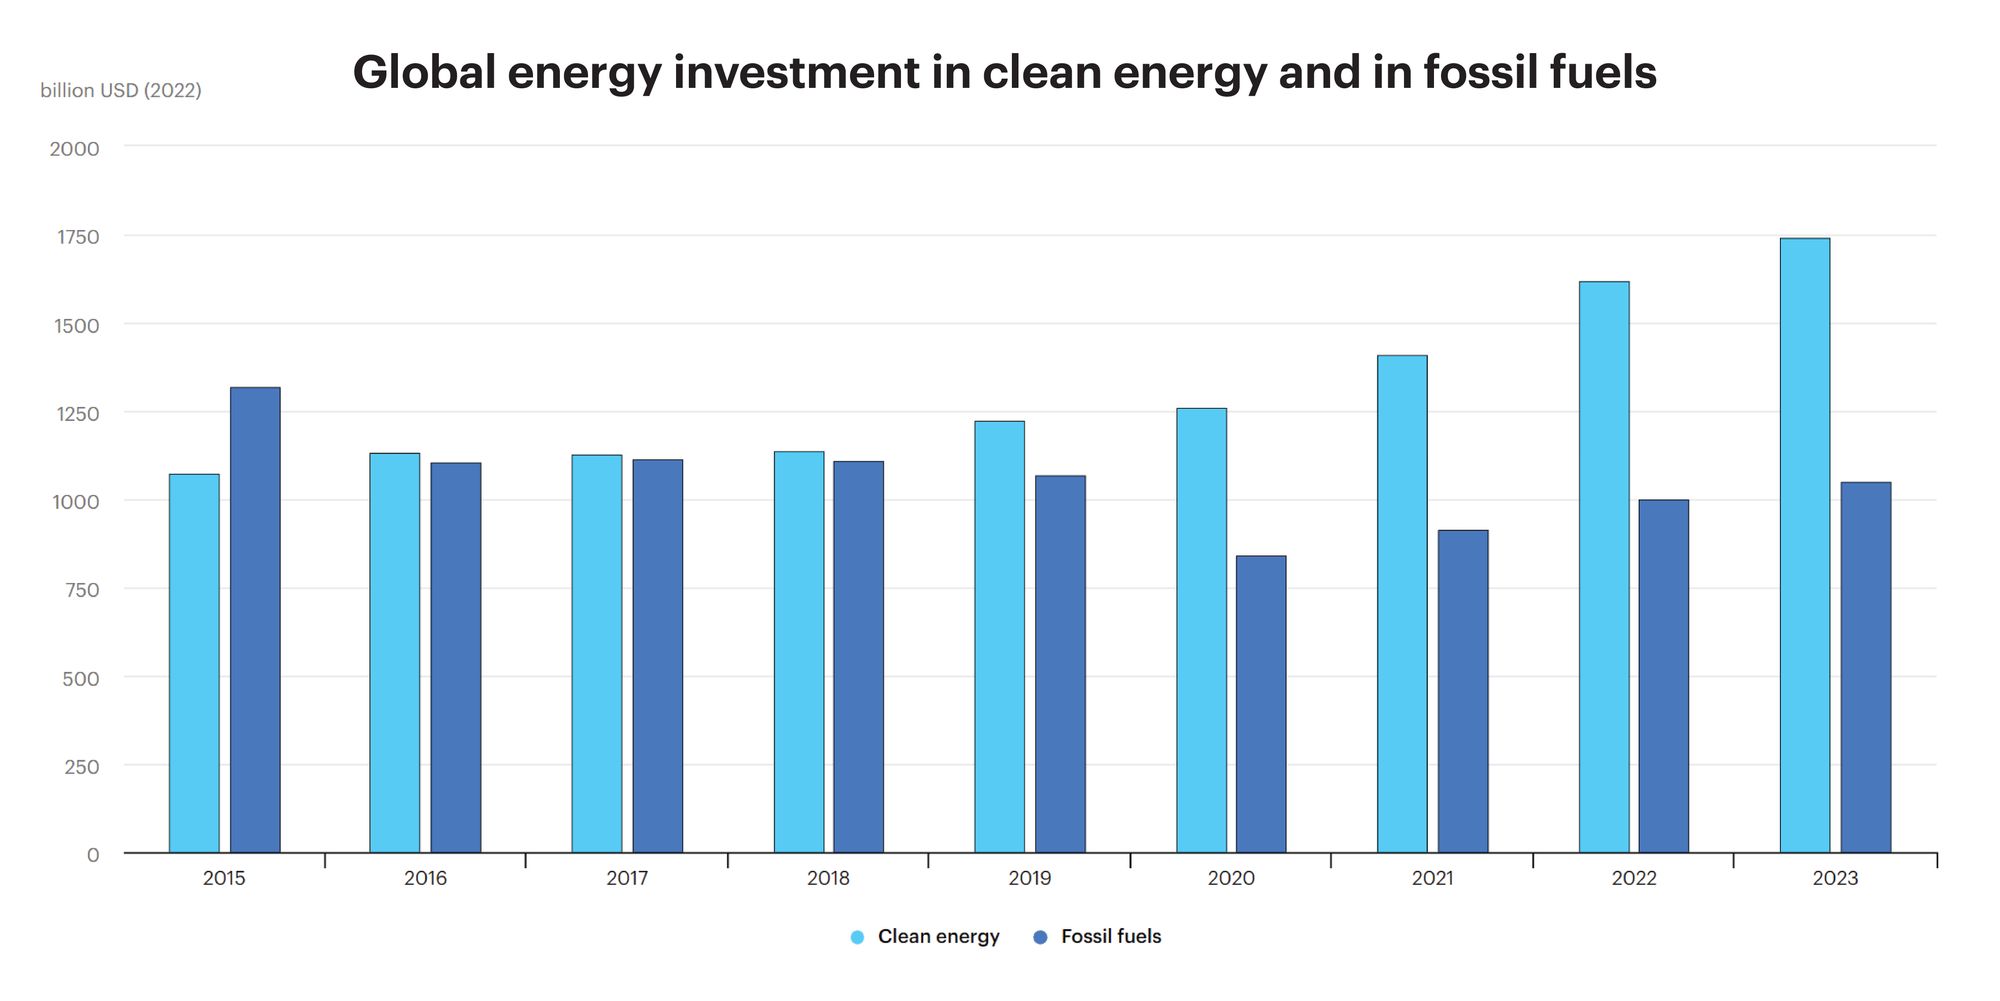
After remaining stagnant for years, only in 2020 did investment in fossil fuels and clean energy significantly diverge. Fossil fuel investment is still too high, but a threshold has been crossed.

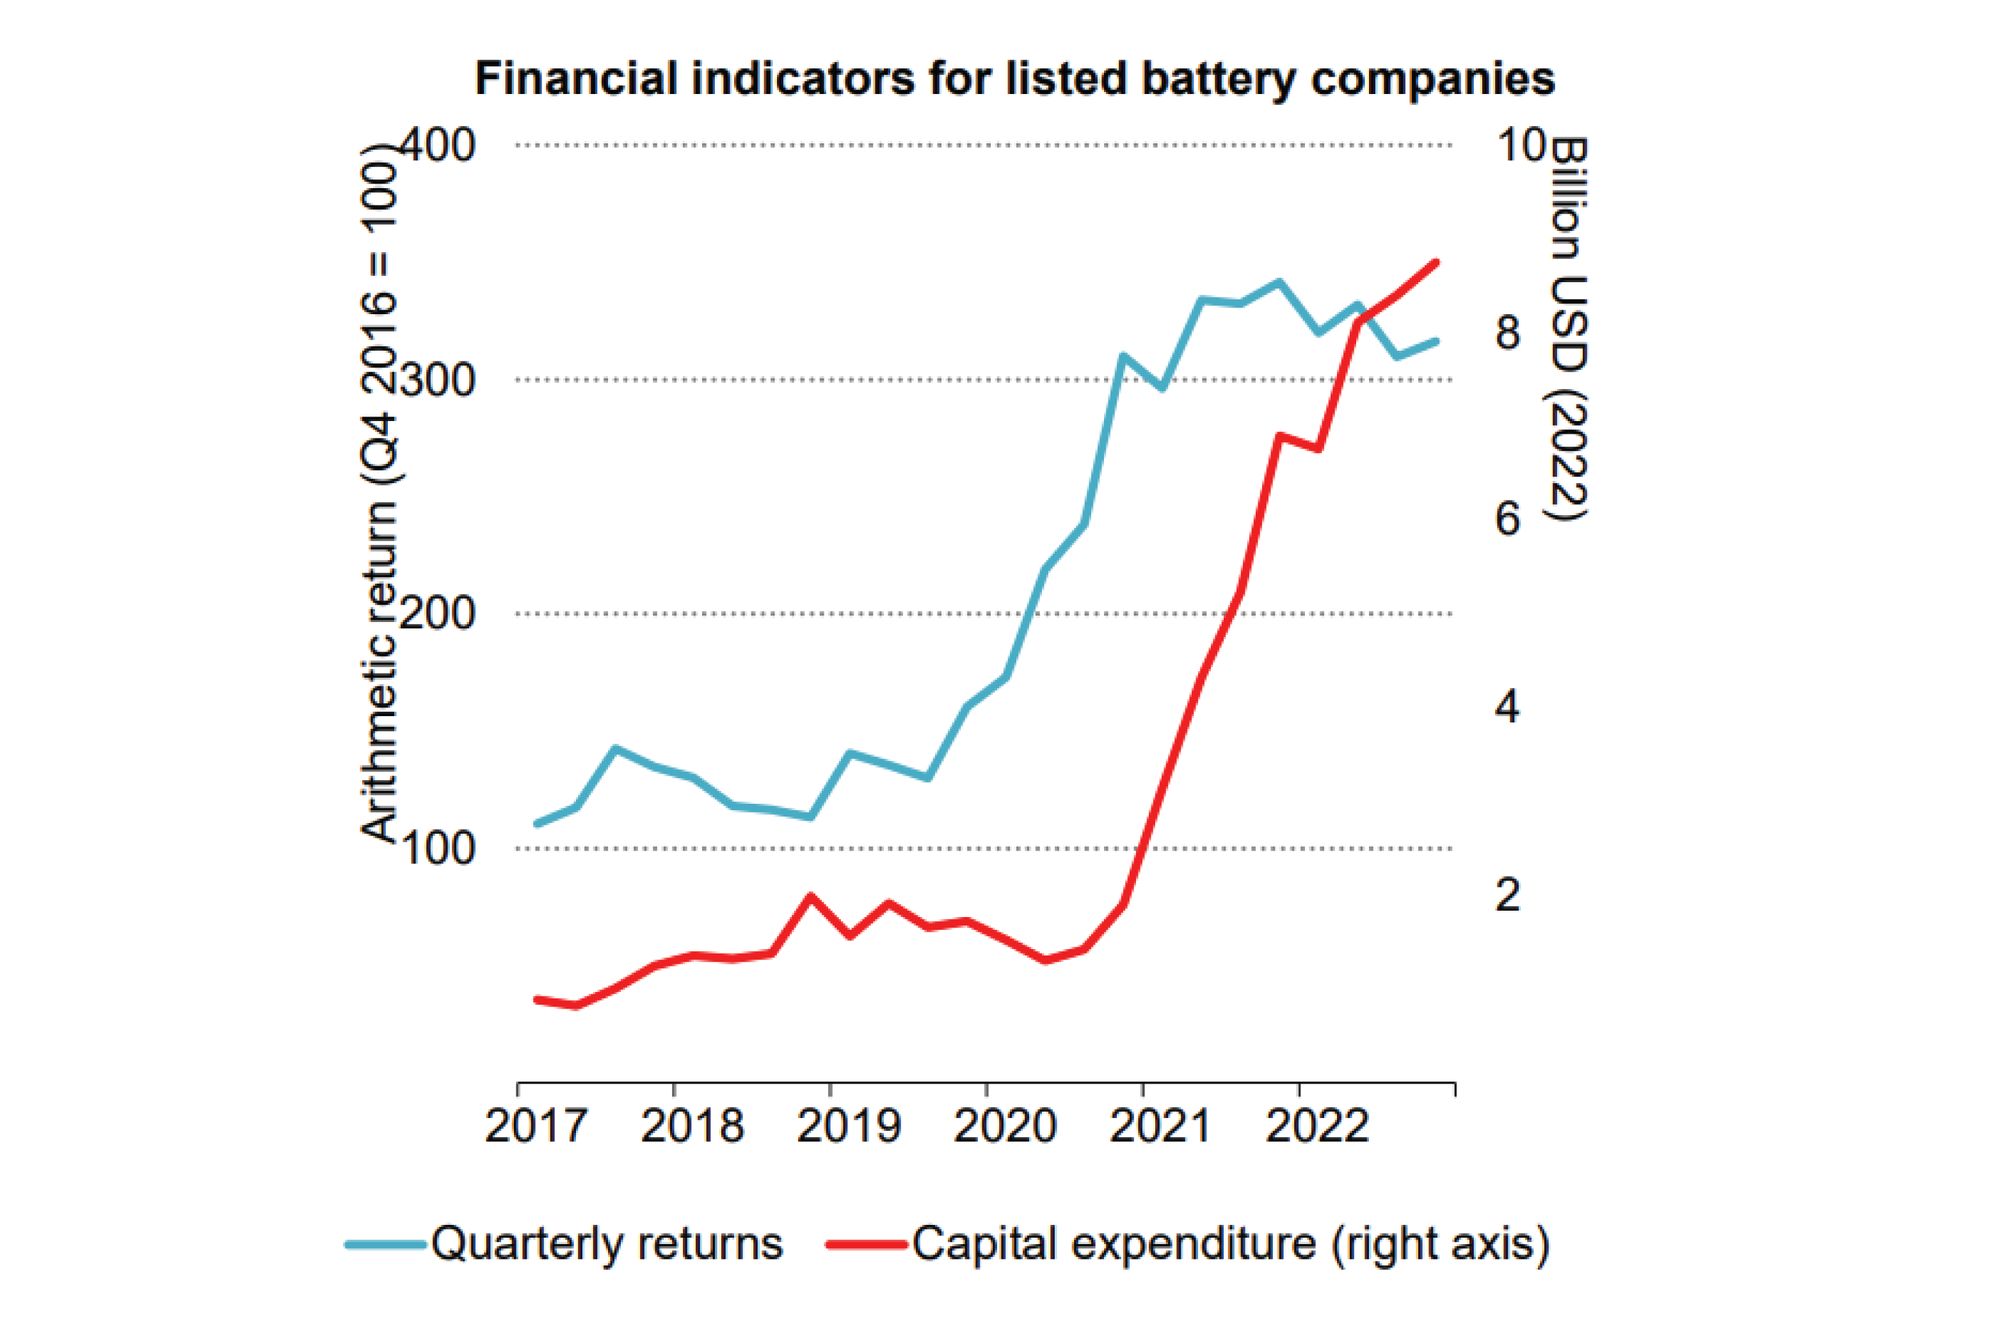
Cheap renewables get firmed by cheap batteries.


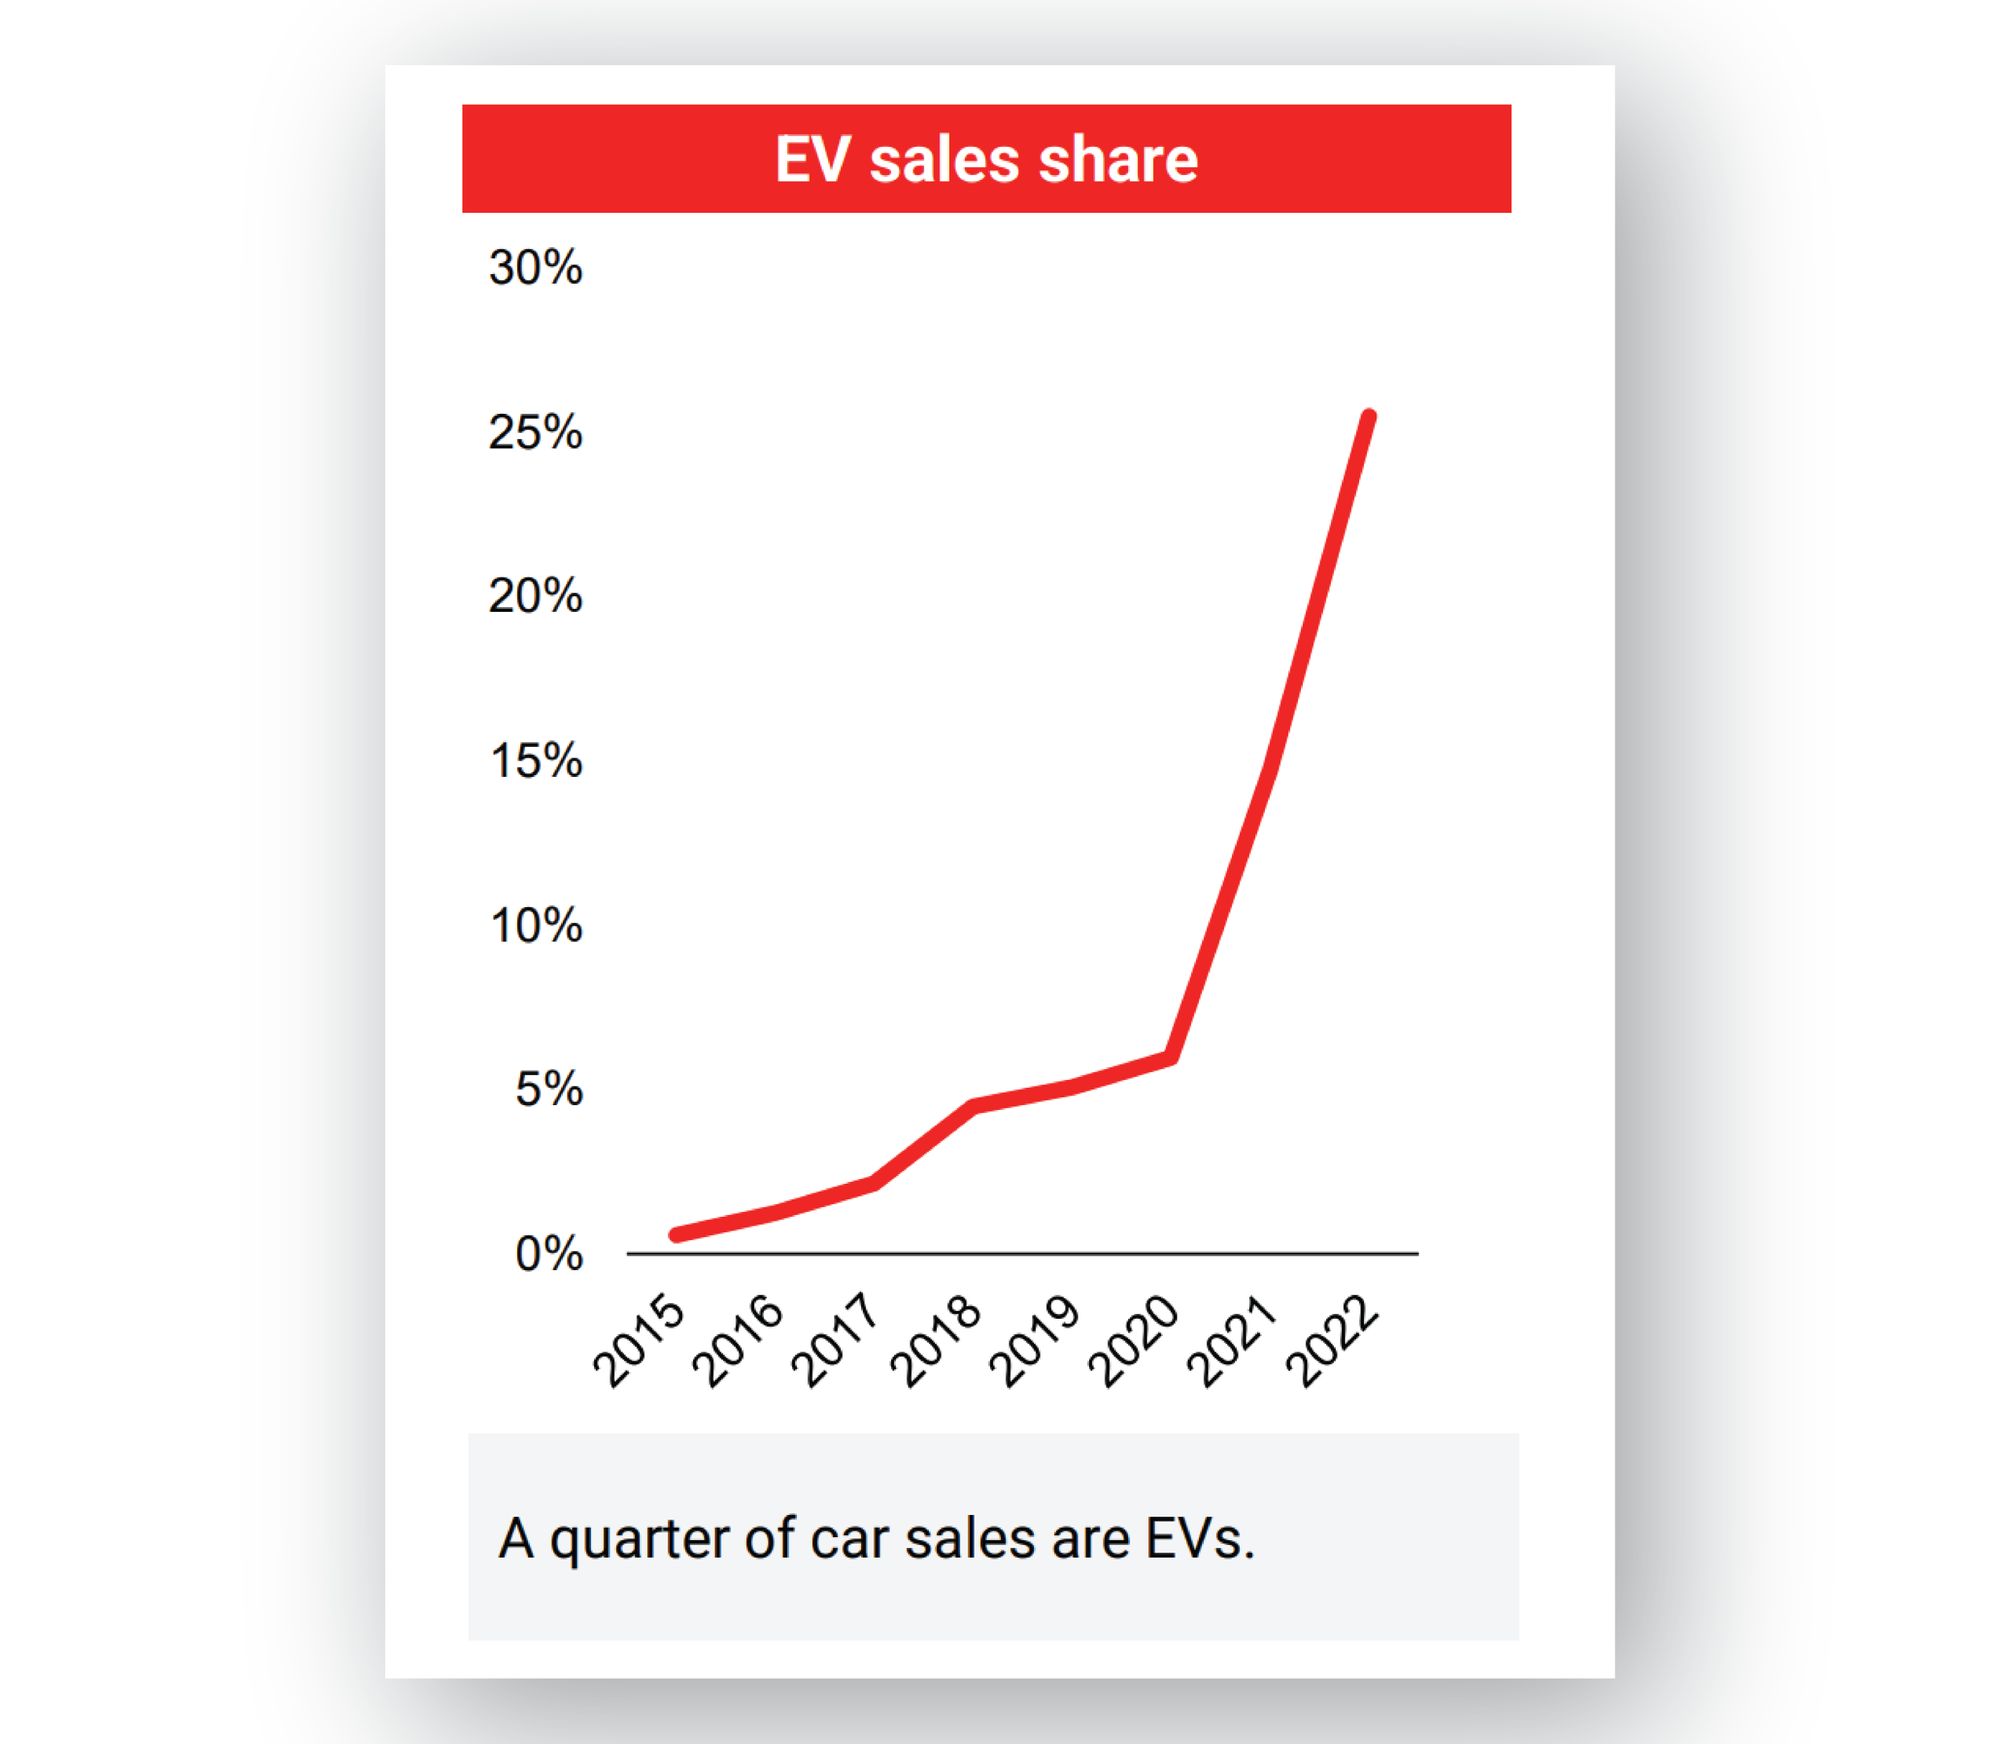
EV sales have tripled since 2020.

In China, a quarter of new car sales are now EVs.

Heat pumps are having a moment too. Here’s heat pump sales in Europe:

and the US:

Green hydrogen is becoming investable.

Since 2020, oil and gas companies have quadrupled their spending on clean energy (even if it’s still a woefully tiny proportion of their investments). I hesitated about including this, but a tiny proportion of a large amount is still quite big (check the axis of the chart).

Zooming out, the overall investment in the energy transition has nearly doubled since 2020.

Onwards
This isn't a victory lap - we're still way off target. But electrification is a self-reinforcing spiral, which means that we're standing at the bottom of a giant exponential curve. Change happens slowly, then all at once.